Why do three departments report three different revenue figures? Fragmented reporting, and the separate definitions each department uses, causes more misery than solutions. How to fix it, you will read below.
Do you recognize this scenario during a quarterly review? The management slide shows last quarter’s revenue, but the hard numbers paint a completely different picture:
Sales: reports €4.2 million
Finance: works with €4.1 million
Operations: sees €4.4 million on the dashboard
The frustrating part: the data itself is not wrong. Each department simply reports straight from its own source system and applies its own criteria.
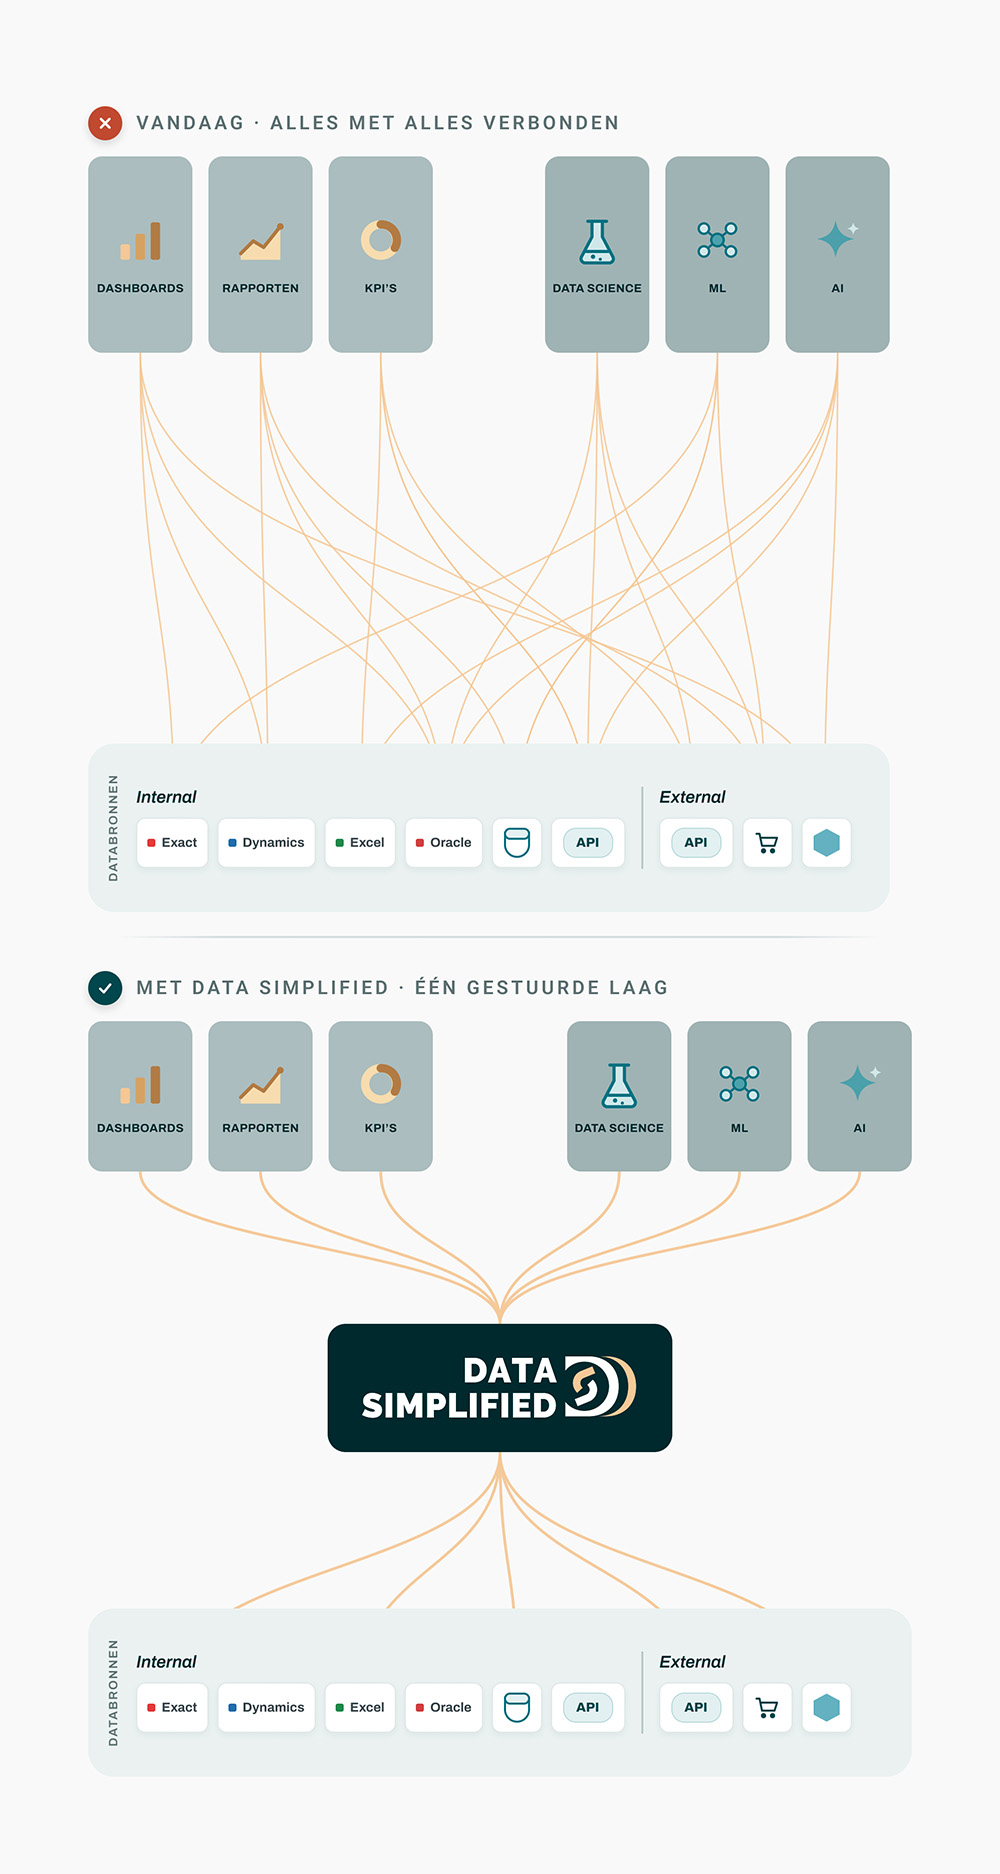
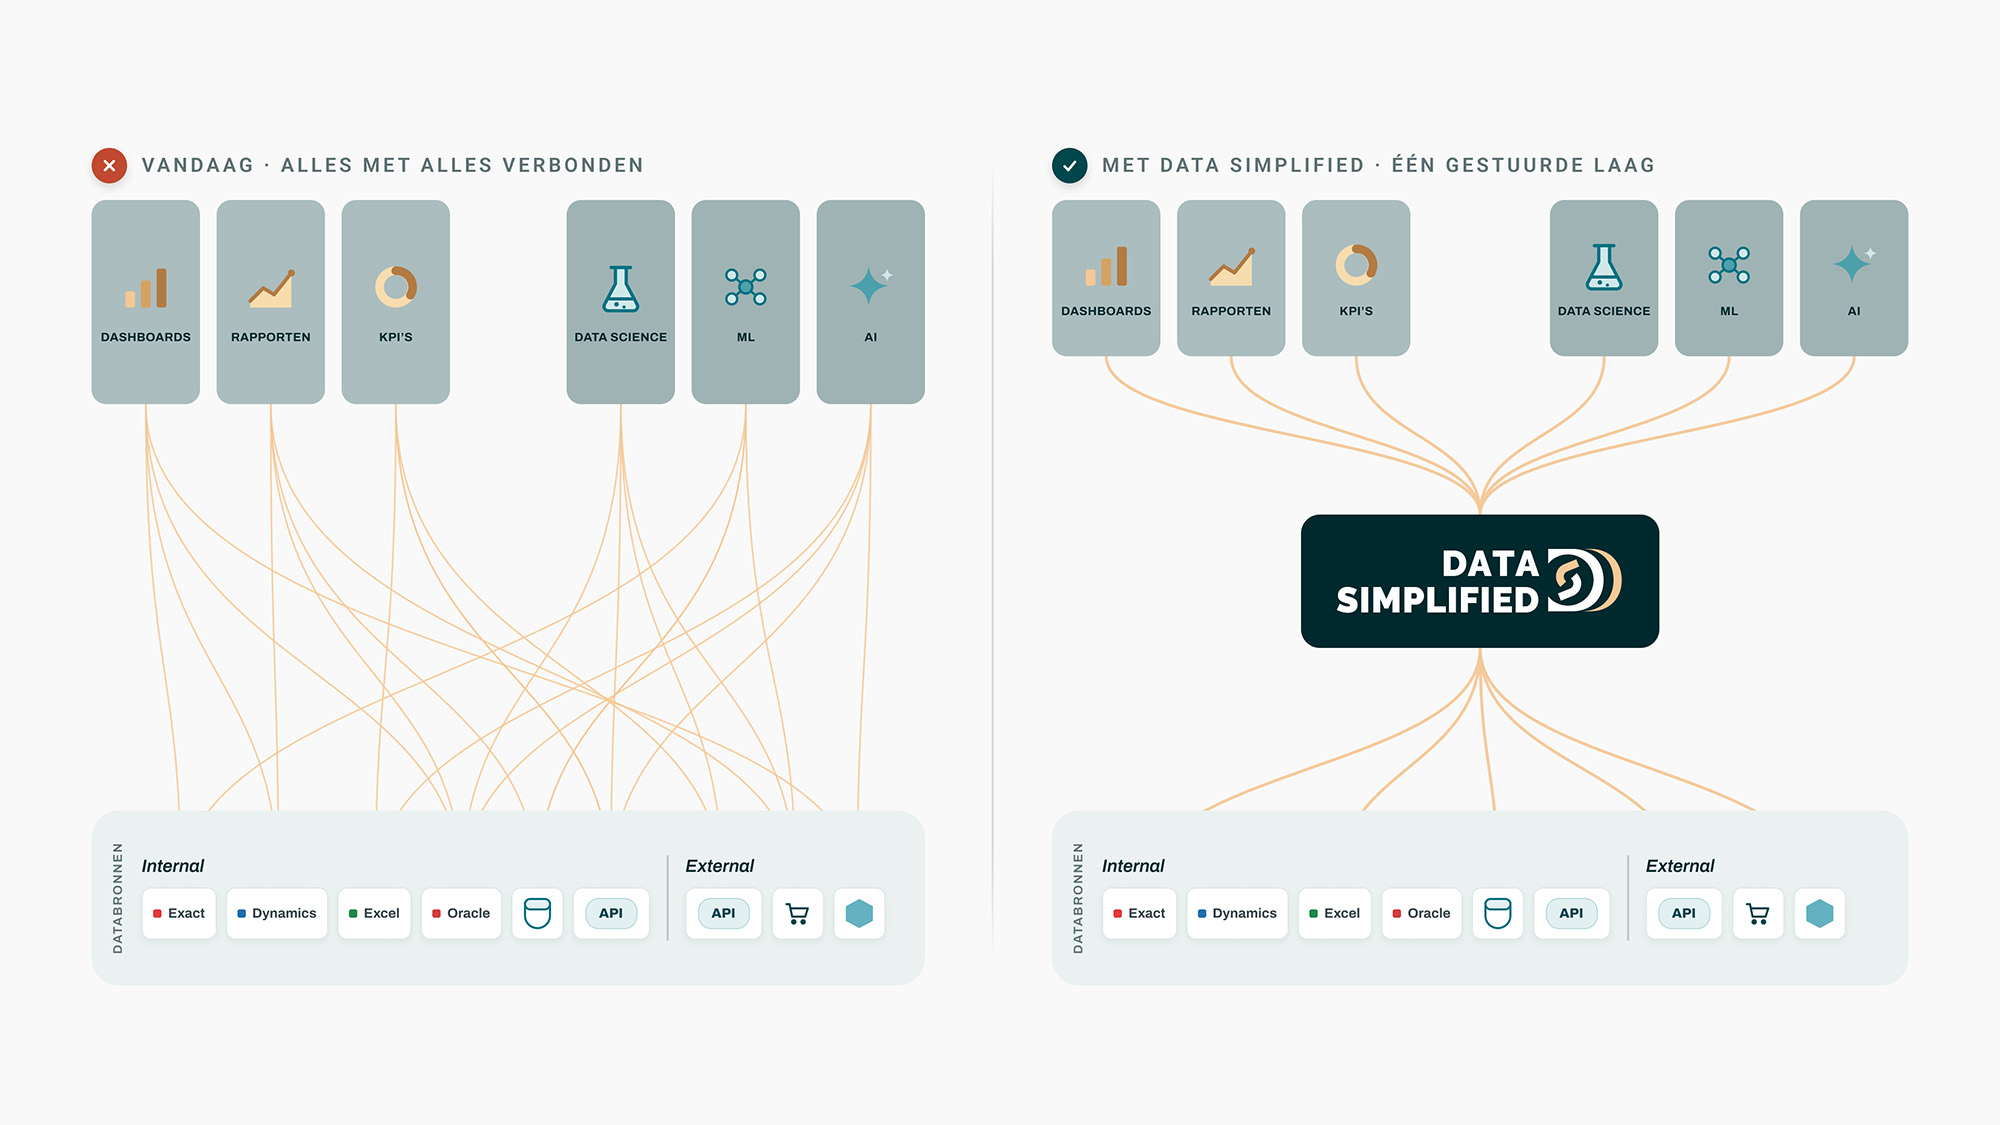
The problem: fragmented reporting
When teams report directly on their own ERP or CRM, data silos appear. The result is conflicting numbers, long discussions in management meetings about who has the right figures, and decisions that get postponed because no one really trusts the data anymore. A software migration is the solution, or so you would think. But it makes things worse, because historical data gets scattered.
The solution: one central source
The key lies in a centralized data platform. In it, the different angles (confirmed, invoiced, or delivered) are made explicit and aligned with each other. The numbers differ where they should, but match where they need to match.
This pays off almost immediately:
Efficiency & scalability: no more manual Excel lists. The platform grows smoothly with your business and keeps reporting intact even during software migrations.
Ready for AI: it eliminates inconsistent reports and creates the reliable, rich data foundation that is indispensable for advanced analytics and future AI initiatives.
KEY TAKEAWAY
Centralize your data so every department looks at the same version of the truth. This eliminates frustration and becomes the fuel for confident, data-driven decisions across your entire organization.
DOWNLOAD THE FULL LONGread
This is blunder 1 of 4. Want all three blunders, including insights and solutions?